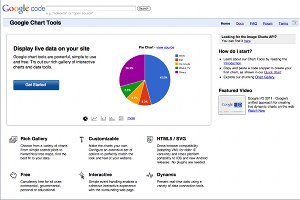
Google Chart Tools
Javascript API from Google to easily create visualization charts, also from real-time data.
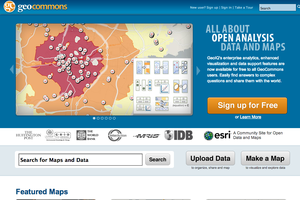
GeoCommons
Toolkit, community and service around the visualization and sharing of geodata.
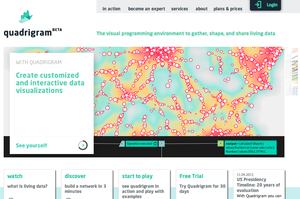
Quadrigram
Professional platform with paid plans for creating customized data visualizations.
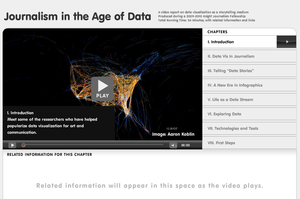
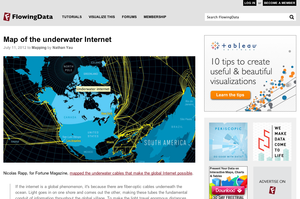
Journalism in the Age of Data - ...
Video report on data visualization as a storytelling medium (54 min)
produced during a Knight Journalism Fellowship (2009-2010).
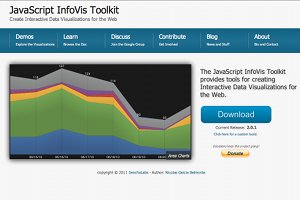
JavaScript InfoVis Toolkit
Javascript toolkit for creating data visualizations with support of various chart types.
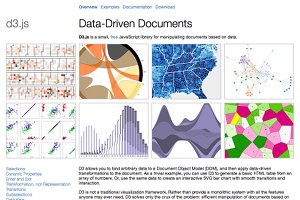
d3.js - Data-Driven Documents
Small and very flexible open-source JavaScript library for manipulating documents based on data (e.g. to generate HTML5 or SVG charts from data).
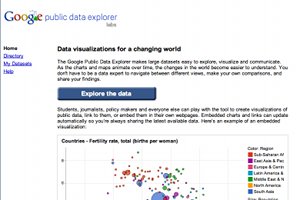
Google Public Data Explorer
Online public dataset directory and tool to publish and visualize large datasets.
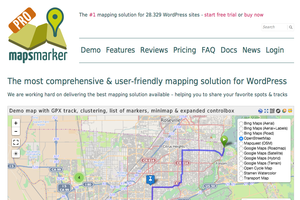
Maps Marker WP-Plugin
Wordpress plugin for showing maps annotated with places of interest in a Wordpress blog.
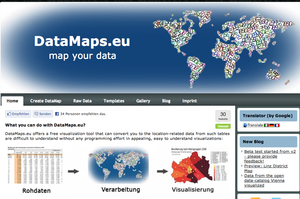
DataMaps.eu - map your data
Tool for the creation of appealing map visualizations, which can be created within the website without programming knowledge.

Ushahidi
Open source software for information collection, visualization and interactive mapping of location-based realtime data (e.g. from emergency situations, political elections, ...).

Eclipse BIRT
Reporting system for eclipse to create visually compelling reports from large amounts of data.